
The Bigger Picture: Cost of Living vs. Income
Looking strictly at income only tells half the story. To understand what a household’s finances actually look like on a day-to-day basis, you must weigh income against the local cost of living. The Bureau of Economic Analysis calculates Regional Price Parities (RPPs), which measure how much goods and services cost in each state compared to the national average.
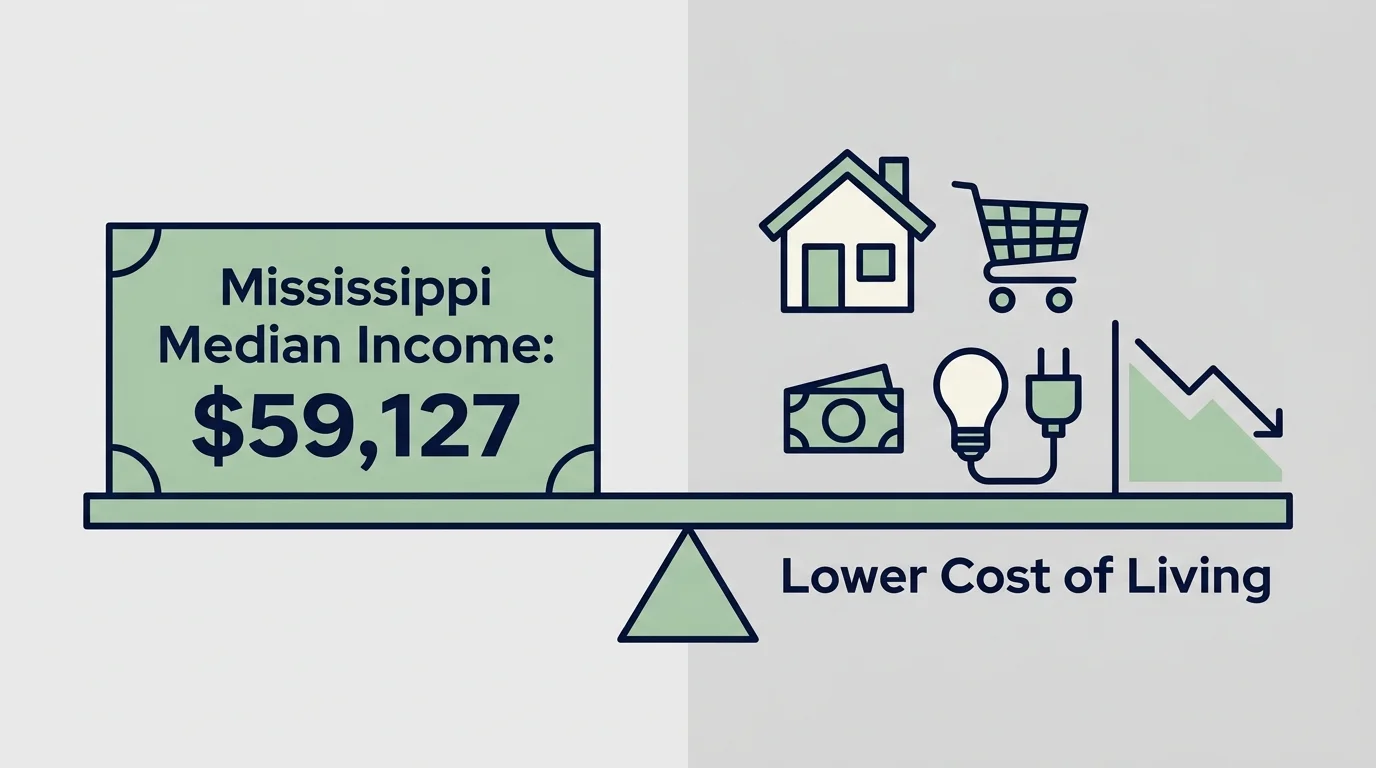
When you apply this lens, the math changes significantly. For example, Arkansas and Mississippi consistently record the lowest Regional Price Parities in the nation, hovering around 87.0. This means that everyday expenses—rent, groceries, utilities, and healthcare—cost roughly 13 percent less than the national average. By contrast, states with massive median incomes like California and Hawaii have RPPs exceeding 110, meaning everything is substantially more expensive.
While a lower median income indicates regional economic challenges, it frequently goes hand-in-hand with drastically reduced housing and daily living costs, completely changing the math for retirees and remote workers.
If you work remotely and retain a salary pegged to a national or coastal standard, moving to a state like West Virginia or Arkansas effectively acts as a massive raise. Your housing costs will plummet, leaving a much larger percentage of your income available for investing, saving for retirement, or discretionary spending. However, if you are relying on the local job market, your lower living expenses will likely be entirely offset by a correspondingly lower salary.
| State | Median Household Income (Approx.) | Estimated Poverty Rate | Cost of Living (National = 100) |
|---|---|---|---|
| Mississippi | $59,127 | 18% | 87.0 |
| West Virginia | $57,917 | 17% | 88.3 |
| Louisiana | $58,229 | 18% | 89.0 |
| Arkansas | $58,773 | 16% | 86.9 |
| New Mexico | $62,468 | 17% | 90.0 |








Leave a Reply