
When you compare median household incomes across the country, a nearly $55,000 gap separates the wealthiest Americans from those living in the poorest US states. Based on the latest US Census Bureau data, the national median household income sits at roughly $83,730, but several states fall more than $20,000 short of that mark.
If you are considering relocating for a lower cost of living or just trying to understand broader economic trends, knowing where these financial disparities exist helps you make more informed decisions.
The states ranking lowest for income often feature drastically cheaper housing and everyday expenses, but they also face distinct challenges regarding poverty rates, infrastructure, and local job markets.
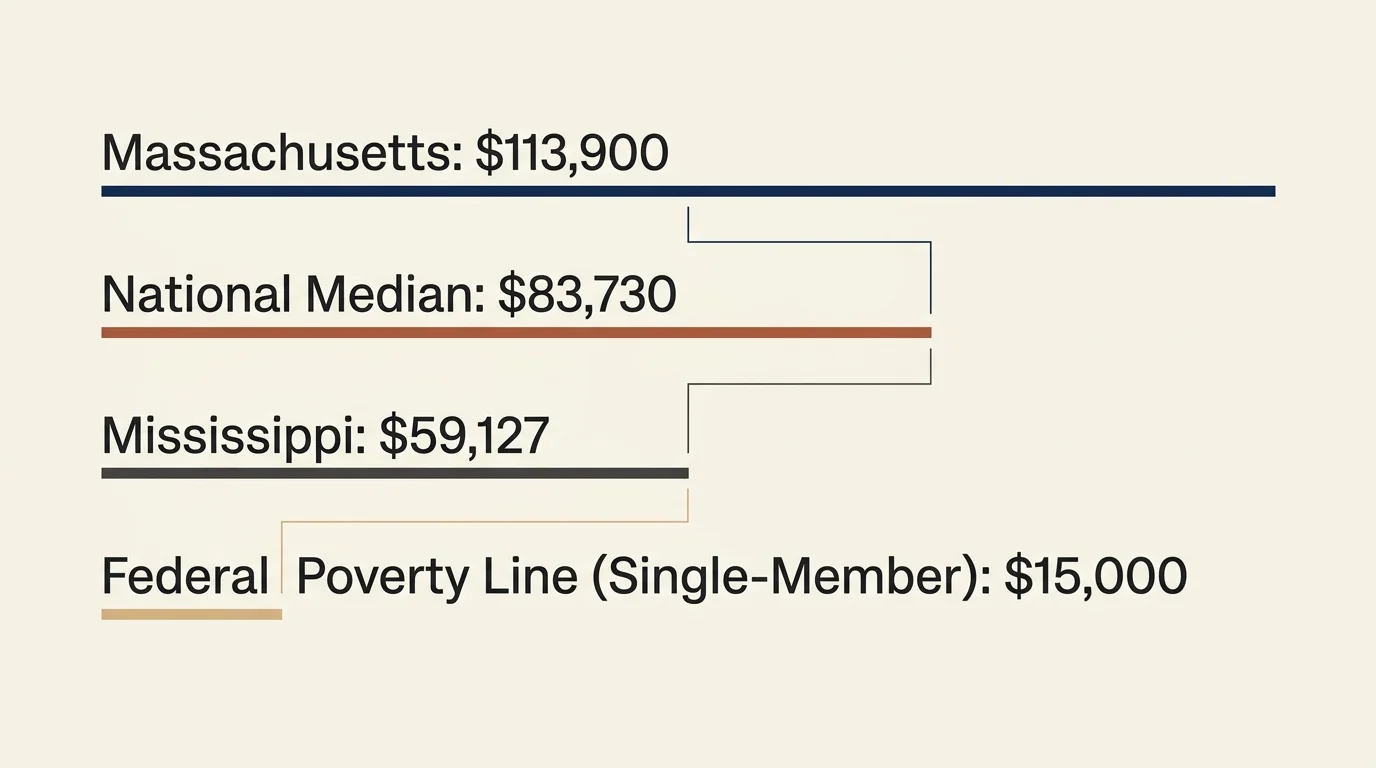
At a Glance: How Income and Poverty Are Measured
Before diving into the state-by-state breakdown, it helps to understand exactly how economists and government agencies measure wealth and poverty. The most common metric used to determine the financial health of a state is the median household income. This number represents the exact midpoint of all households in a specific region; half of the households earn more than this amount, and half earn less.
Because it avoids being heavily skewed by a small number of billionaires at the very top, the median household income provides a highly accurate picture of what a typical family actually brings home in a year.
In addition to median income, states are frequently evaluated by their poverty rate. The federal poverty threshold is calculated annually to reflect the absolute minimum income required to cover basic life necessities like food, clothing, and shelter.
Currently, the federal poverty guideline for a single-member household sits around $15,000 a year, scaling upward for each additional family member. When a state has a low median income, it almost always carries a higher percentage of residents living below this federal poverty line.
The US Census Bureau tracks these figures meticulously through the American Community Survey (ACS) and the Current Population Survey (CPS). The data reveals sharp regional divides, with Northeastern and West Coast states generally reporting the highest incomes, while Southern and Appalachian states frequently report the lowest.
To put this in perspective, Massachusetts currently boasts a median household income of roughly $113,900, while the poorest state in the nation sits closer to $59,000.









Leave a Reply