
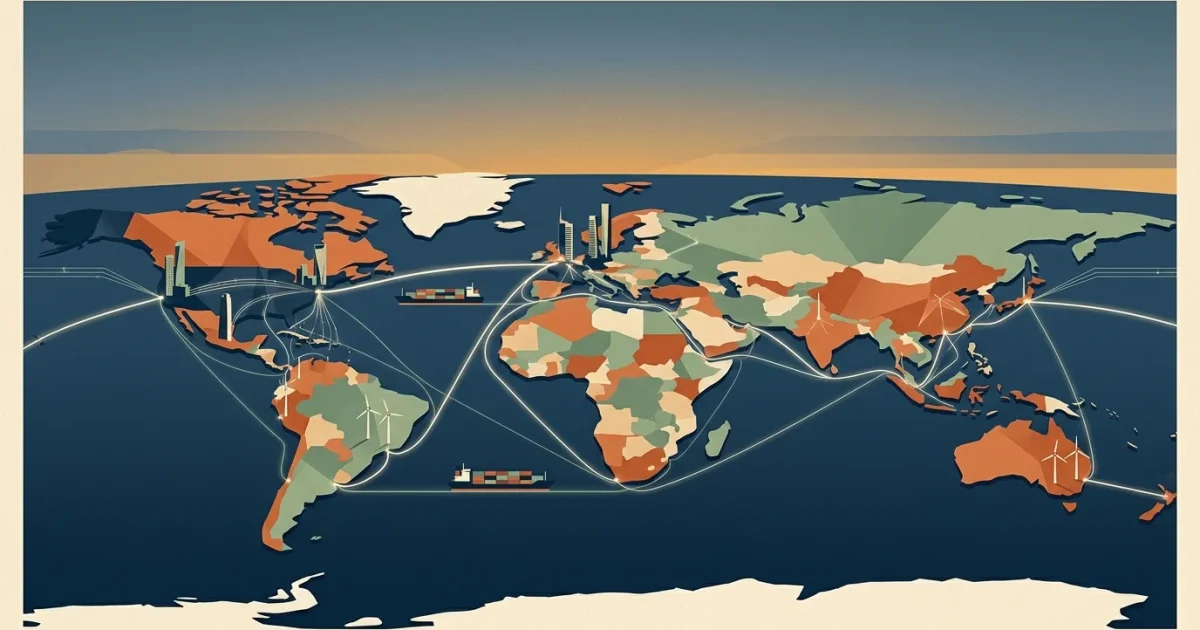
The world’s 25 largest economies generate over 80% of global economic output, shaping everything from the price of your groceries to the returns in your 401(k). Understanding where global wealth concentrates helps you make smarter choices about international investments, consumer spending, and retirement planning.
The United States retains the top spot with an economic output exceeding $30 trillion, but rapid expansion across Asia and currency fluctuations across Europe continue shifting the global economic rankings.
Here is the definitive guide to the largest national economies ranked by nominal Gross Domestic Product (GDP), along with the practical financial takeaways every American household should know.

At a Glance: The World’s Biggest Economies List
Economists measure the size of a national economy primarily through nominal Gross Domestic Product (GDP). Nominal GDP calculates the total market value of all finished goods and services produced within a country’s borders in a given year, converted into U.S. dollars at current market exchange rates. According to data tracked by the International Monetary Fund (IMF) and the World Bank, the top 10 economies account for roughly two-thirds of total global output.
| Rank | Country | Nominal GDP (Trillions USD) | Share of Global GDP | Primary Economic Drivers |
|---|---|---|---|---|
| 1 | United States | $30.60 T | ~25.8% | Technology, Financial Services, Consumer Spending, Healthcare |
| 2 | China | $19.40 T | ~16.4% | Manufacturing, Industrial Output, Infrastructure, Technology |
| 3 | Germany | $5.00 T | ~4.2% | Automotive, Precision Machinery, Chemicals, Engineering |
| 4 | Japan | $4.30 T | ~3.6% | Automotive, Consumer Electronics, Robotics, Banking |
| 5 | India | $4.10 T | ~3.5% | Information Technology, Services, Agriculture, Manufacturing |
| 6 | United Kingdom | $3.96 T | ~3.3% | Banking & Financial Services, Pharmaceuticals, Aerospace |
| 7 | France | $3.36 T | ~2.8% | Aerospace, Tourism, Luxury Goods, Agriculture, Energy |
| 8 | Italy | $2.54 T | ~2.1% | Automotive, Fashion & Textiles, Industrial Machinery, Food |
| 9 | Russia | $2.54 T | ~2.1% | Oil & Gas, Mining, Agriculture, Defense Production |
| 10 | Canada | $2.28 T | ~1.9% | Energy, Mining, Real Estate, Financial Services, Timber |
| 11 | Brazil | $2.26 T | ~1.9% | Agriculture (Soy, Beef), Mining, Energy, Manufacturing |
| 12 | Spain | $1.89 T | ~1.6% | Tourism, Financial Services, Renewable Energy, Agriculture |
| 13 | Mexico | $1.86 T | ~1.6% | Automotive Manufacturing, Electronics, Oil, Remittances |
| 14 | South Korea | $1.86 T | ~1.6% | Semiconductors, Electronics, Automobiles, Shipbuilding |
| 15 | Australia | $1.83 T | ~1.5% | Mining (Iron Ore, Coal), Financial Services, Agriculture |
| 16 | Türkiye (Turkey) | $1.57 T | ~1.3% | Textiles, Automotive, Construction, Tourism |
| 17 | Indonesia | $1.44 T | ~1.2% | Coal, Palm Oil, Manufacturing, Domestic Consumption |
| 18 | Netherlands | $1.32 T | ~1.1% | Agriculture & Food Tech, Logistics, Semiconductor Tools |
| 19 | Saudi Arabia | $1.27 T | ~1.1% | Petroleum & Petrochemicals, Natural Gas, Construction |
| 20 | Poland | $1.04 T | ~0.9% | Manufacturing, Information Technology, Logistics |
| 21 | Switzerland | $1.00 T | ~0.8% | Wealth Management, Pharmaceuticals, Precision Instruments |
| 22 | Taiwan | $0.88 T | ~0.7% | Advanced Semiconductors, Electronics Hardware, Machinery |
| 23 | Belgium | $0.75 T | ~0.6% | Chemicals, Pharmaceuticals, Logistics, Food Processing |
| 24 | Ireland | $0.71 T | ~0.6% | Multinational Corporate Tech, Pharmaceuticals, Medical Devices |
| 25 | Argentina | $0.68 T | ~0.6% | Agriculture (Soy, Wheat), Lithium, Energy, Food Processing |

The Top 5 Economic Powerhouses
The top five nations on the world’s biggest economies list control roughly half of all annual global gross domestic product. While their rankings have remained relatively stable over the past two decades, recent monetary policy decisions, demographic shifts, and currency swings have reshuffled key positions.
1. United States (Nominal GDP: $30.6+ Trillion)
The United States continues to lead all top GDP countries ranked worldwide. Domestic consumer spending accounts for nearly 70% of total American economic activity, supported by deep capital markets, high business investment, and dominant technology firms. According to the U.S. Bureau of Economic Analysis, productivity growth and steady employment gains have preserved America’s lead over secondary rivals.
2. China (Nominal GDP: $19.4+ Trillion)
China holds the second-largest nominal economy, driven by unmatched industrial production, heavy infrastructure spending, and an expanding domestic consumer base. While real estate sector corrections and an aging demographic have slowed annual expansion from double-digit rates to around 4% to 5%, China remains the world’s primary manufacturing engine and the largest trading partner for dozens of sovereign nations.
3. Germany (Nominal GDP: $5.0 Trillion)
Germany climbed to the third spot among the largest national economies, overtaking Japan. This change was largely driven by currency dynamics rather than surging domestic output; significant depreciation of the Japanese yen against the euro elevated Germany’s dollar-equivalent GDP. Germany remains the industrial backbone of Europe, anchored by high-end vehicle manufacturing, mechanical engineering, and basic chemical production.
4. Japan (Nominal GDP: $4.3 Trillion)
Japan occupies the fourth position globally. Decades of low domestic inflation combined with prolonged monetary easing kept Japanese bond yields and the yen lower relative to the U.S. dollar. Even as the Bank of Japan moved away from negative interest rates, the lower exchange rate depressed Japan’s nominal valuation in U.S. dollar terms. However, Japan remains a global hub for advanced robotics, high-tech manufacturing, and automotive excellence.
5. India (Nominal GDP: $4.1 Trillion)
India stands out as the fastest-growing major economy on earth, consistently posting annual real GDP growth around 6.5%. Having surpassed the United Kingdom, India’s upward momentum stems from a youthful population, massive public infrastructure upgrades, a surging digital services export sector, and expanding manufacturing capacity under supply chain diversification initiatives.
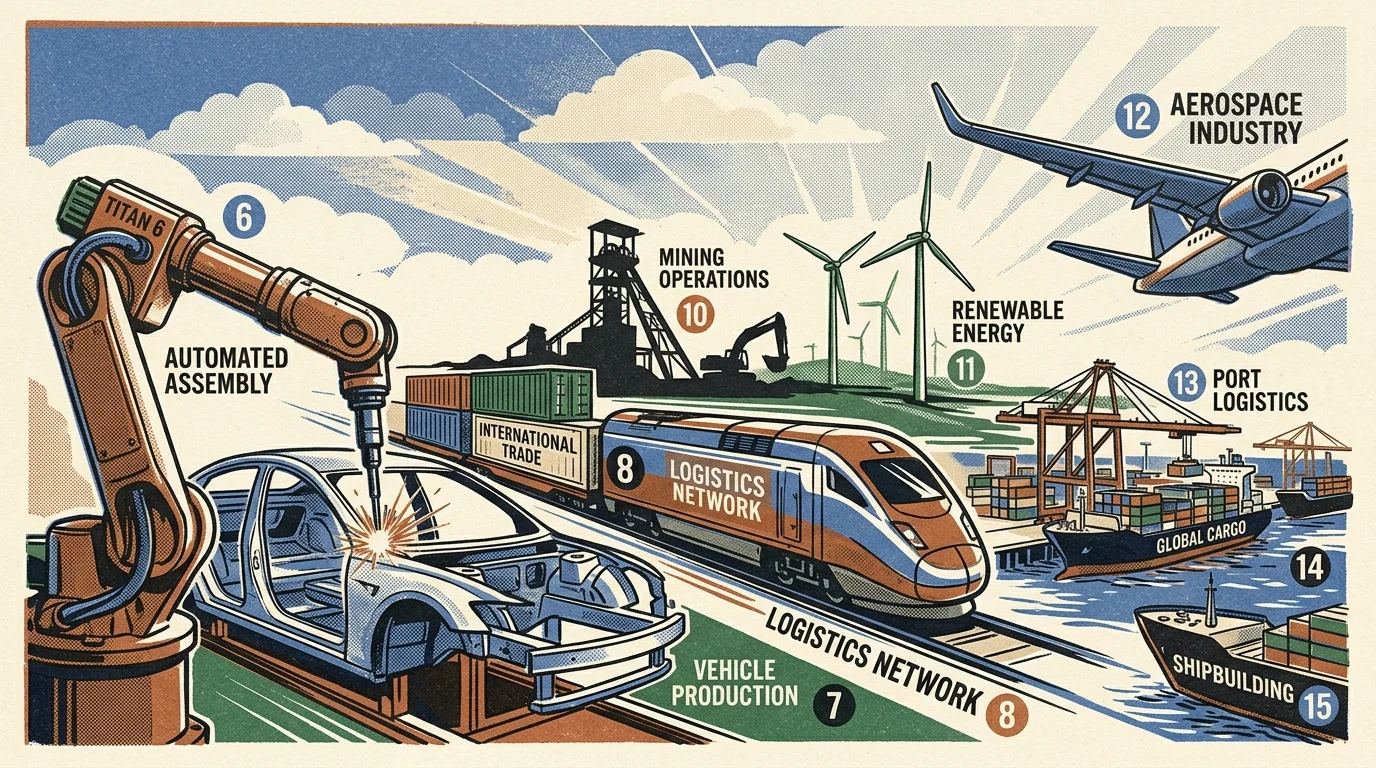
Key Players Ranked 6 Through 15: Industrial Titans and Trade Hubs
The middle tier of the top 25 largest economies contains mature Western powers alongside rapidly expanding resource exporters.
- United Kingdom (#6, $3.96T) & France (#7, $3.36T): The UK relies heavily on London’s financial services hub and aerospace engineering, while France blends public-sector infrastructure with global dominance in luxury goods, commercial aviation, and agricultural exports.
- Italy (#8, $2.54T) & Russia (#9, $2.54T): Italy maintains strong trade surpluses through high-end precision machinery and consumer brands. Russia’s output remains anchored by fossil fuels, mineral exports, and sustained state defense spending.
- Canada (#10, $2.28T) & Australia (#15, $1.83T): Both commodity-rich Commonwealth nations provide critical raw materials, natural gas, uranium, and grains to international markets, while operating highly capitalized domestic banking systems.
- Brazil (#11, $2.26T) & Mexico (#13, $1.86T): Latin America’s twin powerhouses serve distinct functions. Brazil leads agricultural and energy production in the Southern Hemisphere; Mexico benefits immensely from North American nearshoring, manufacturing billions of dollars in automotive and electronic goods for U.S. consumers under the USMCA trade agreement.
- South Korea (#14, $1.86T): An export powerhouse that manufactures a commanding percentage of the world’s microchips, flat screens, lithium-ion vehicle batteries, and commercial cargo ships.
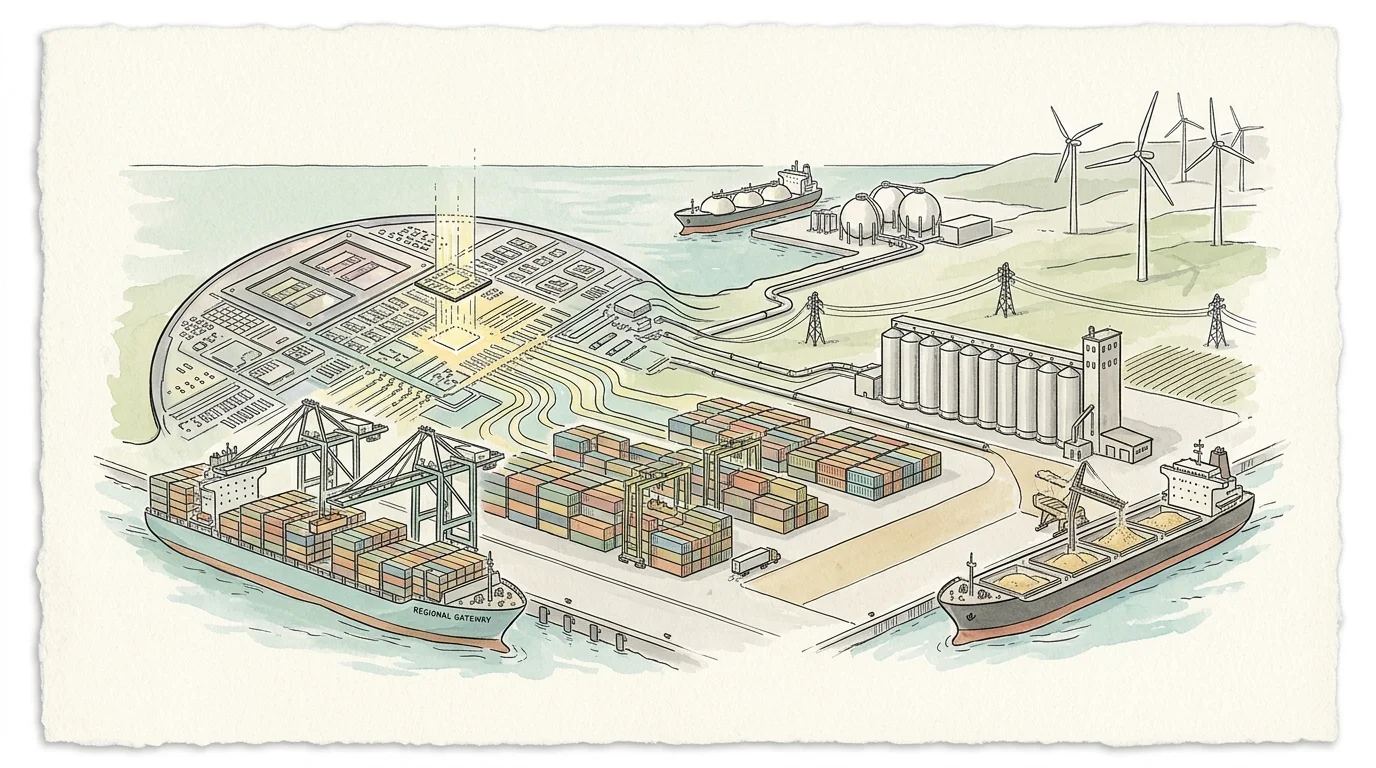
Ranks 16 Through 25: Energy, Specialized Tech, and Regional Gateways
Positions 16 through 25 highlight the vital role of specialized industries in sustaining economic scale:
- Türkiye (#16, $1.57T) & Indonesia (#17, $1.44T): Indonesia serves as Southeast Asia’s anchor economy through nickel mining and domestic consumer markets, while Türkiye bridges trade corridors connecting Europe, Central Asia, and the Middle East.
- Netherlands (#18, $1.32T), Switzerland (#21, $1.00T), and Belgium (#23, $0.75T): These European economies boast immense per capita productivity. The Netherlands houses advanced semiconductor manufacturing equipment makers like ASML, Switzerland manages massive global private wealth, and Belgium serves as Europe’s central chemical and logistical transit hub.
- Saudi Arabia (#19, $1.27T): The Middle East’s largest economy leverages energy revenues to finance Vision 2030 industrial diversification projects.
- Poland (#20, $1.04T): Central Europe’s economic success story, Poland crossed the trillion-dollar milestone through integrated manufacturing, tech support hubs, and strong domestic consumption.
- Taiwan (#22, $0.88T): A cornerstone of the global digital economy, producing more than 90% of the world’s most advanced semiconductor microchips.
- Ireland (#24, $0.71T) & Argentina (#25, $0.68T): Ireland acts as the European corporate headquarters for global tech and biotech giants, while Argentina rounds out the top 25 with agricultural exports and major lithium reserves.

Nominal GDP vs. Purchasing Power Parity (PPP)
When reviewing largest economies in the world ranked by output, you will frequently encounter two distinct metrics: Nominal GDP and Purchasing Power Parity (PPP) GDP. Understanding the difference prevents confusion when comparing global living standards and national output.
Nominal GDP converts a country’s output directly into U.S. dollars using prevailing market exchange rates. This metric accurately reflects a country’s absolute spending power on the international stage—such as purchasing imported oil, servicing foreign debt, or buying multinational assets.
Purchasing Power Parity adjusts for the local cost of living and inflation rates. In countries where housing, labor, and domestic services cost significantly less than in the United States, an adjusted dollar buys far more economic value. When measured by PPP:
- China ranks #1 globally with a PPP-adjusted GDP surpassing $40 trillion, reflecting the massive domestic purchasing volume of its 1.4 billion residents.
- India jumps to #3 globally with a PPP output near $16 trillion, far above its nominal ranking of #5.
- The United States ranks #2 under PPP, because American prices for domestic services, healthcare, and housing are higher than in developing markets.
For your everyday budget, PPP explains why a remote worker or retiree can live comfortably on $2,500 a month in countries like Mexico, Indonesia, or Spain, whereas that same dollar figure provides a modest lifestyle in major U.S. metropolitan areas.

How Global Economic Rankings Impact Your Wallet
Tracking the world’s largest economies is not just an academic exercise; shifts in global rankings directly influence your personal budget, retirement accounts, and consumer purchasing choices.
1. International Stock Index Allocations
If you invest in broad-market retirement funds like total world stock index funds (such as Vanguard’s VT or VXUS), your money automatically flows into these 25 countries. Because the top 25 economies represent over 80% of world GDP, their corporate earnings dictate your dividend yields and capital gains. A heavy international allocation gives your portfolio exposure to fast-growing hubs like India, Mexico, and Southeast Asia while balancing domestic market exposure.
2. The Strength of the U.S. Dollar
The U.S. dollar remains the world’s premier reserve currency, driven by the size and stability of the American economy. When the dollar trades at multi-year highs against currencies like the Japanese yen, euro, or British pound, everyday Americans gain distinct advantages:
- Lower Import Costs: Imported electronics from South Korea, vehicles from Germany, and groceries from Mexico cost less at the checkout counter, dampening domestic consumer inflation.
- Cheaper Overseas Travel: Your vacation budget stretches significantly farther in nations whose currencies have weakened relative to the dollar, allowing budget travelers to book lodging, meals, and transport at substantial discounts.
3. Supply Chain Resilience and Everyday Prices
When top-ranked producers experience supply shocks, American pocketbooks feel the friction immediately. Semiconductor production bottlenecks in Taiwan or South Korea quickly lead to higher price tags on new cars, computers, and appliances in U.S. retail stores. Diversification of the global manufacturing base across Mexico, India, and Southeast Asia helps stabilize consumer prices against localized disruptions.

Worth Keeping in Mind
While top GDP countries ranked by raw output provide a high-level snapshot of national strength, GDP metrics come with specific limitations:
- GDP Size Does Not Equal Individual Wealth: A country can hold a massive nominal GDP while its citizens experience modest living standards. For instance, while India and China produce trillions in total output, their GDP per capita is far lower than smaller nations like Switzerland, Norway, or Singapore.
- Currency Volatility Distorts Year-to-Year Rankings: A sudden 15% drop in a foreign currency’s value against the dollar can cause a country to slide down the nominal rankings even if domestic factory production and retail spending actually increased.
- Corporate Accounting Distortions: Certain economies—most notably Ireland—show inflated GDP numbers due to multinational tech and pharmaceutical corporations routing international intellectual property revenues through local subsidiaries (a phenomenon economists often describe as modified domestic demand).
Frequently Asked Questions
Which country has the highest GDP per capita?
While the United States, China, and Germany lead in total economic output, the highest GDP per capita figures belong to smaller, highly specialized nations such as Luxembourg, Ireland, Switzerland, and Norway. These countries combine small populations with highly concentrated financial services, tech, or energy sectors.
Why did Germany overtake Japan in the nominal GDP rankings?
Germany moved ahead of Japan primarily due to currency fluctuations. The Japanese yen experienced steep depreciation against the U.S. dollar and the euro, which reduced the dollar-denominated size of Japan’s economy despite solid underlying industrial performance.
Will India become a top-three economy?
Based on current growth trajectories, economic forecasting models from the IMF and major international banks project that India could surpass both Japan and Germany to secure the third-largest nominal GDP position before 2030.
Actionable Steps for Your Money
Use the stability of the global economic landscape to improve your personal financial health. Review your retirement accounts to ensure low-cost global diversification, capitalize on favorable foreign exchange rates when planning international travel, and monitor how trade shifts affect your household grocery and electronics bills.
This article provides general information only. Every reader’s situation is different—what works for others may not be the right fit for you. For personalized guidance on health, legal, or financial matters, consult a qualified professional.
Last updated: May 2026. Rules, prices, and details change—verify current information with official sources before acting on it.








Leave a Reply