

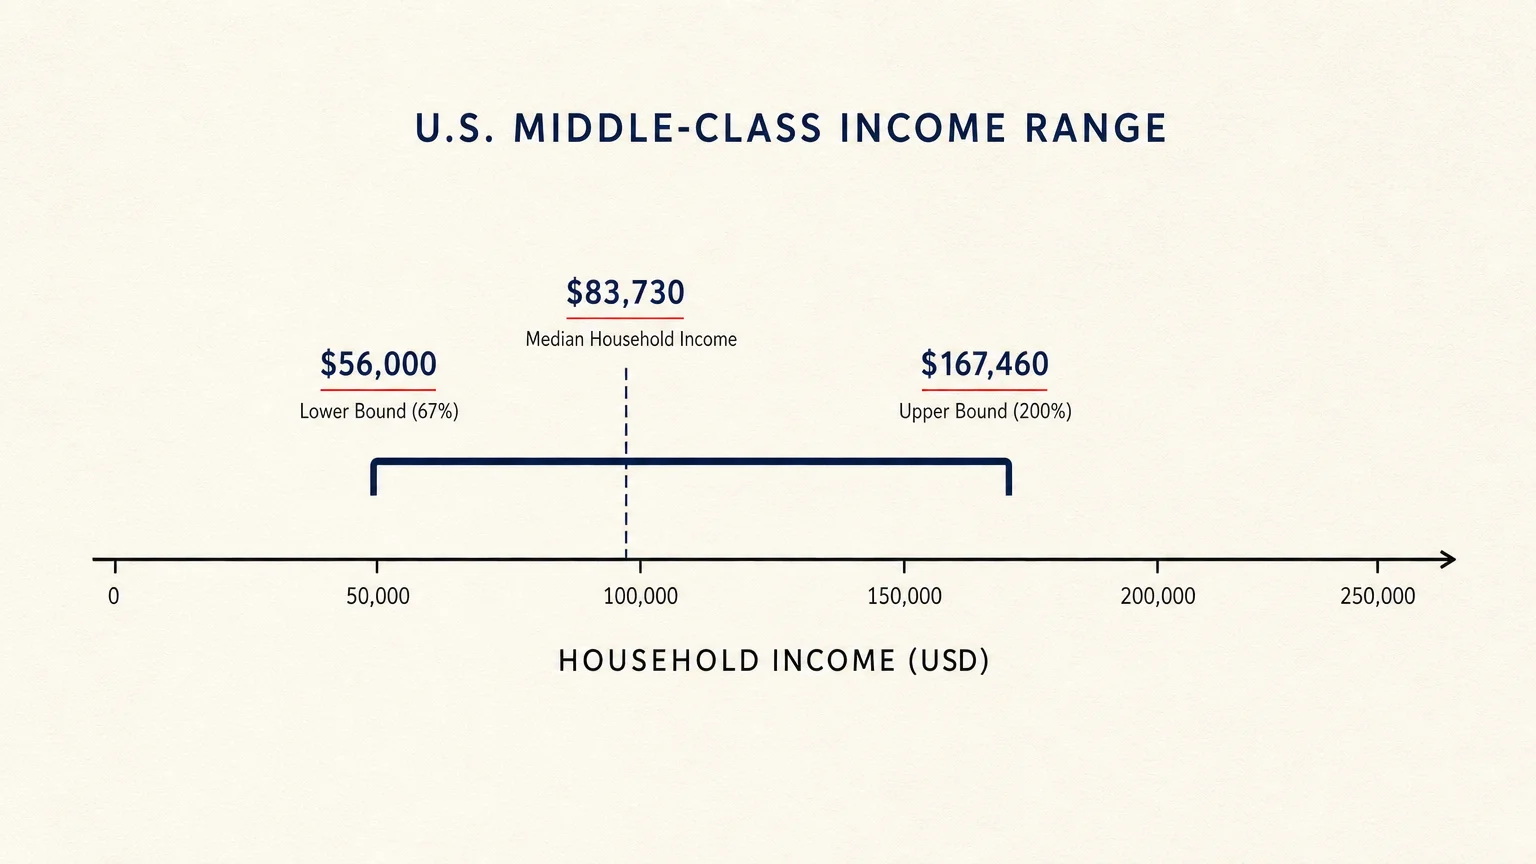
For millions of Americans, earning a middle-class salary no longer guarantees a middle-class lifestyle. According to the Pew Research Center, middle-class households earn between two-thirds and double the national median income, putting the target roughly between $56,000 and $167,000 depending on household size. But looking at raw national averages obscures the reality of what it actually takes to stay afloat in 2026. Skyrocketing housing costs, persistent inflation, and wide state-by-state variations mean your six-figure salary might make you wealthy in Mississippi but leave you budgeting carefully in Massachusetts. Understanding exactly where your income places you can help you set realistic financial goals, evaluate your true purchasing power, and adjust your savings strategies for the road ahead.
The Official Math Behind the Middle Class
Economists and researchers generally avoid defining class purely by lifestyle markers like homeownership or annual vacations, as these fluctuate based on personal choices and local economies. Instead, they rely on hard income data. The most widely accepted definition comes from the Pew Research Center, which classifies middle-income households as those earning between 67 percent and 200 percent of the median household income.
To calculate the baseline, we look to the U.S. Census Bureau. According to the Bureau’s most recent comprehensive income report, the national median household income sits at approximately $83,730. Using the Pew formula, the national middle-class income tier spans roughly $56,000 at the lower bound to about $167,460 at the upper bound.
However, that broad national window assumes a perfectly average cost of living. It serves as a mathematical baseline, not a practical reality. When you apply this formula to your own life, you have to account for where you live and who relies on your paycheck.
State by State: Where Your Income Stretches Furthest
Geography dictates the power of your dollar. Because state median incomes vary wildly, the definition of middle class shifts the moment you cross state lines. In states anchored by thriving tech, finance, and biotechnology sectors, the median income climbs, pulling the middle-class threshold up with it. In states with lower costs of living and different industrial bases, the threshold drops.
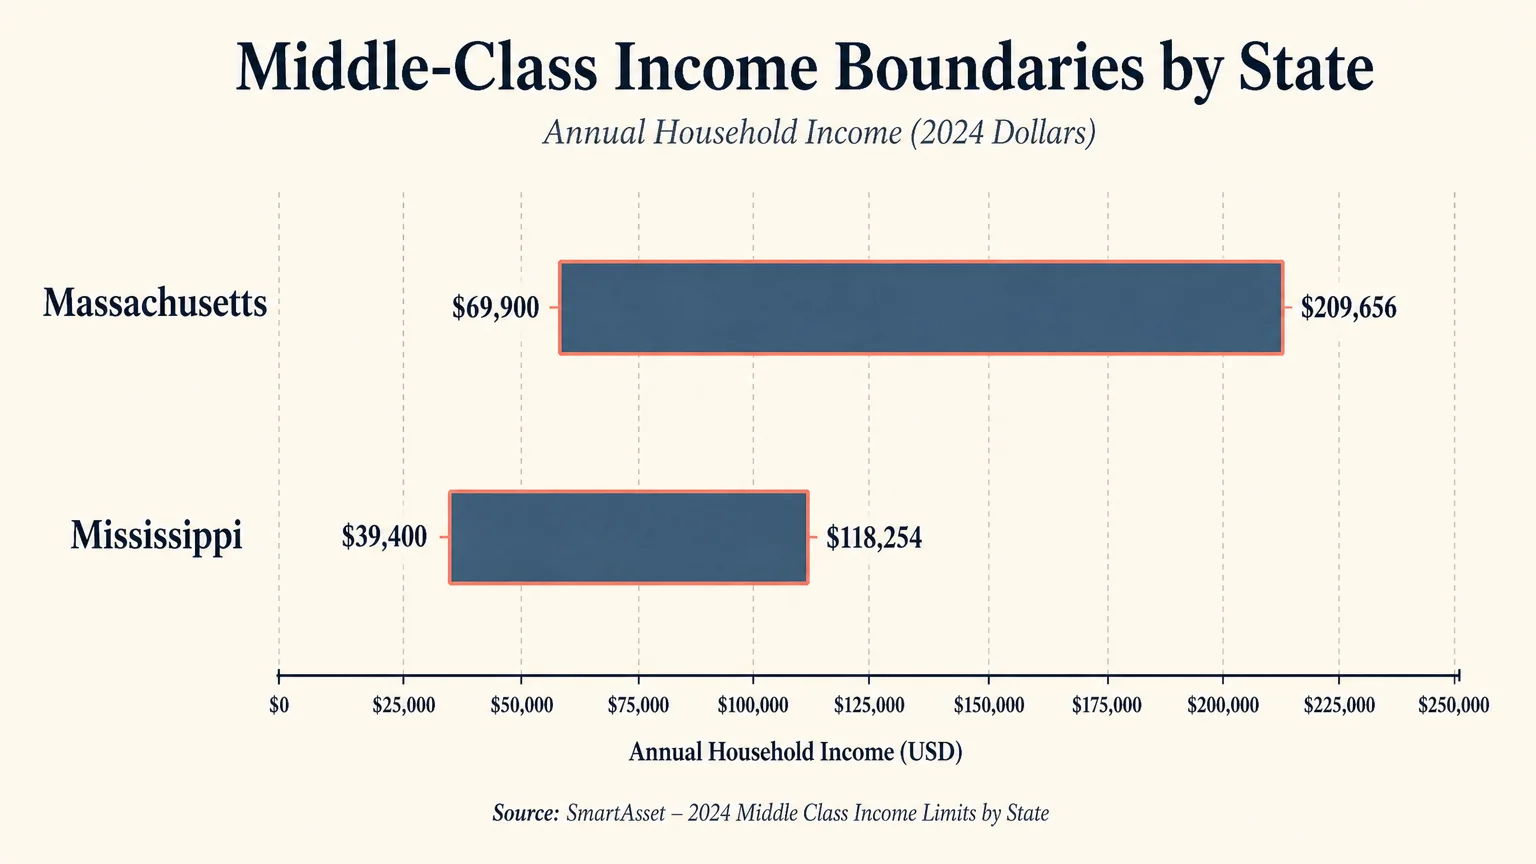
Massachusetts currently holds the highest bar for entering the middle class. Due to high wages and an equally high cost of living, a household in Massachusetts must earn nearly $70,000 just to hit the bottom rung of the middle class, while the upper boundary extends beyond $209,000. Conversely, in Mississippi, the baseline for middle-class entry sits just under $40,000.
Here is a snapshot of the estimated middle-class income boundaries across several diverse states, based on recent Census Bureau median income data:
| State | Lower Bound (To Enter Middle Class) | Upper Bound (To Enter Upper Class) |
|---|---|---|
| Massachusetts | $69,900 | $209,656 |
| New Jersey | $69,500 | $208,588 |
| California | $66,800 | $200,298 |
| Colorado | $64,700 | $194,000 |
| Texas | $52,000 | $156,000 |
| West Virginia | $40,532 | $121,596 |
| Mississippi | $39,400 | $118,254 |
These numbers highlight why a $120,000 salary feels incredibly comfortable in the rural South but requires strict budgeting to manage rent and utilities in the Northeast or along the West Coast.
How Household Size Moves the Goalposts
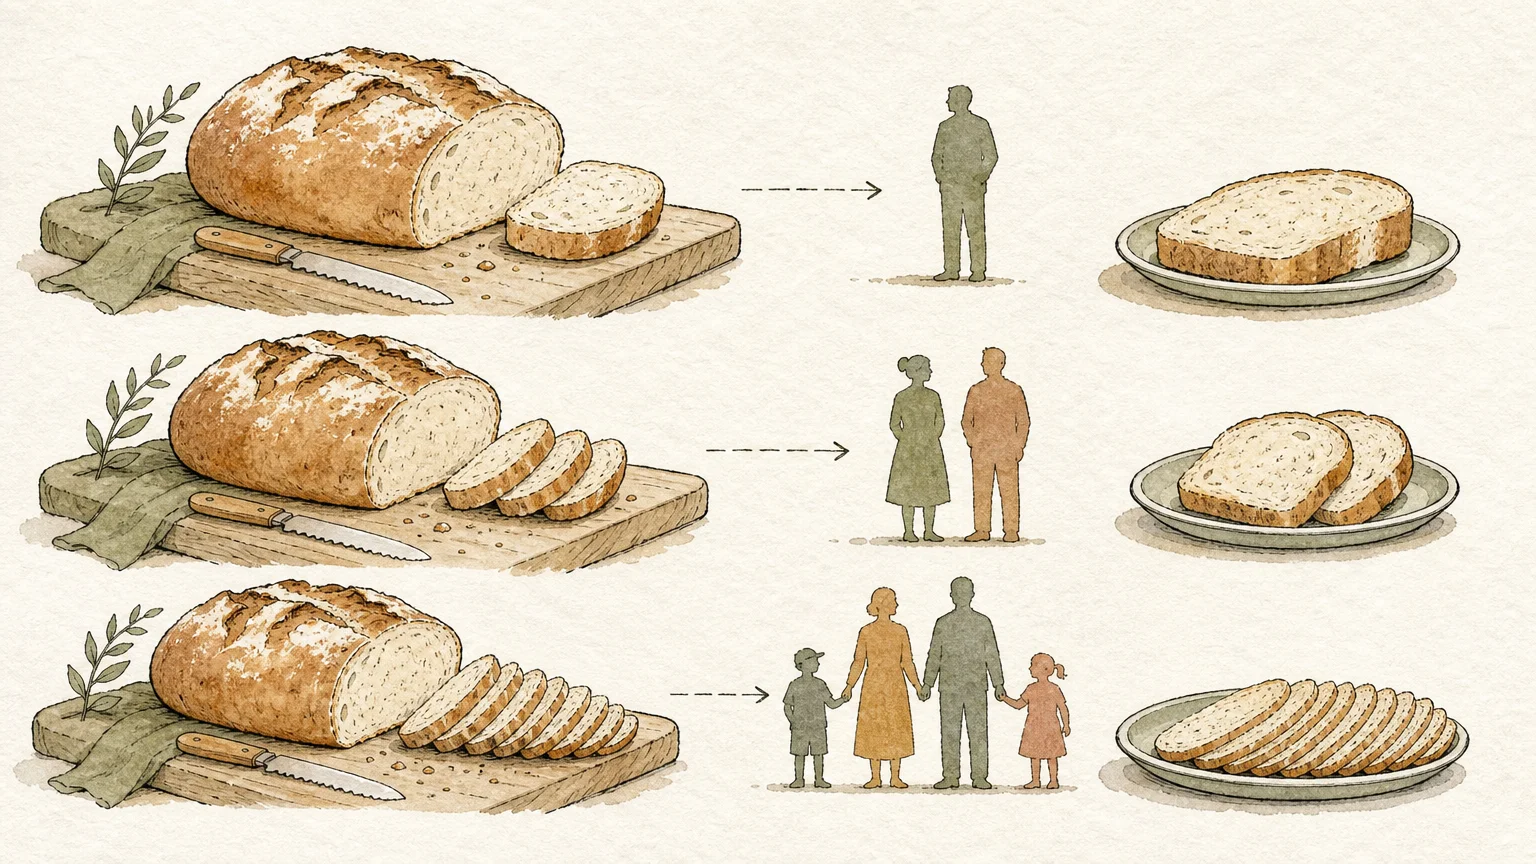
A $75,000 income serves a single professional differently than it serves a family of four. To reflect this reality, economists adjust middle-class income tiers based on household size. The formula scales up to account for the additional costs of feeding, housing, and insuring more people.
When adjusted for household size in 2026, the estimated national middle-class parameters look completely different:
- One-Person Household: The middle-class range runs approximately $40,000 to $110,000. A single earner making $115,000 statistically lands in the upper-income tier.
- Two-Person Household: The window shifts to roughly $55,000 to $160,000. Couples earning below this floor fall into the lower-income bracket.
- Three-Person Household: The threshold climbs to between $65,000 and $190,000. This often captures single parents with two children or dual-income couples with one child.
- Four-Person Household: A family of four typically needs between $80,000 and $230,000 to remain squarely in the middle class.
If your household grows through the birth of a child or an aging parent moving in, your income must scale proportionately just to maintain your current statistical tier.
Income vs. Purchasing Power: The Quiet Squeeze
Falling within the middle-class income brackets brings little comfort if you cannot afford the traditional markers of a middle-class lifestyle. Historically, identifying as middle class implied a specific level of financial security: owning a home, saving for retirement, accessing reliable healthcare, taking an annual vacation, and setting aside funds for education.
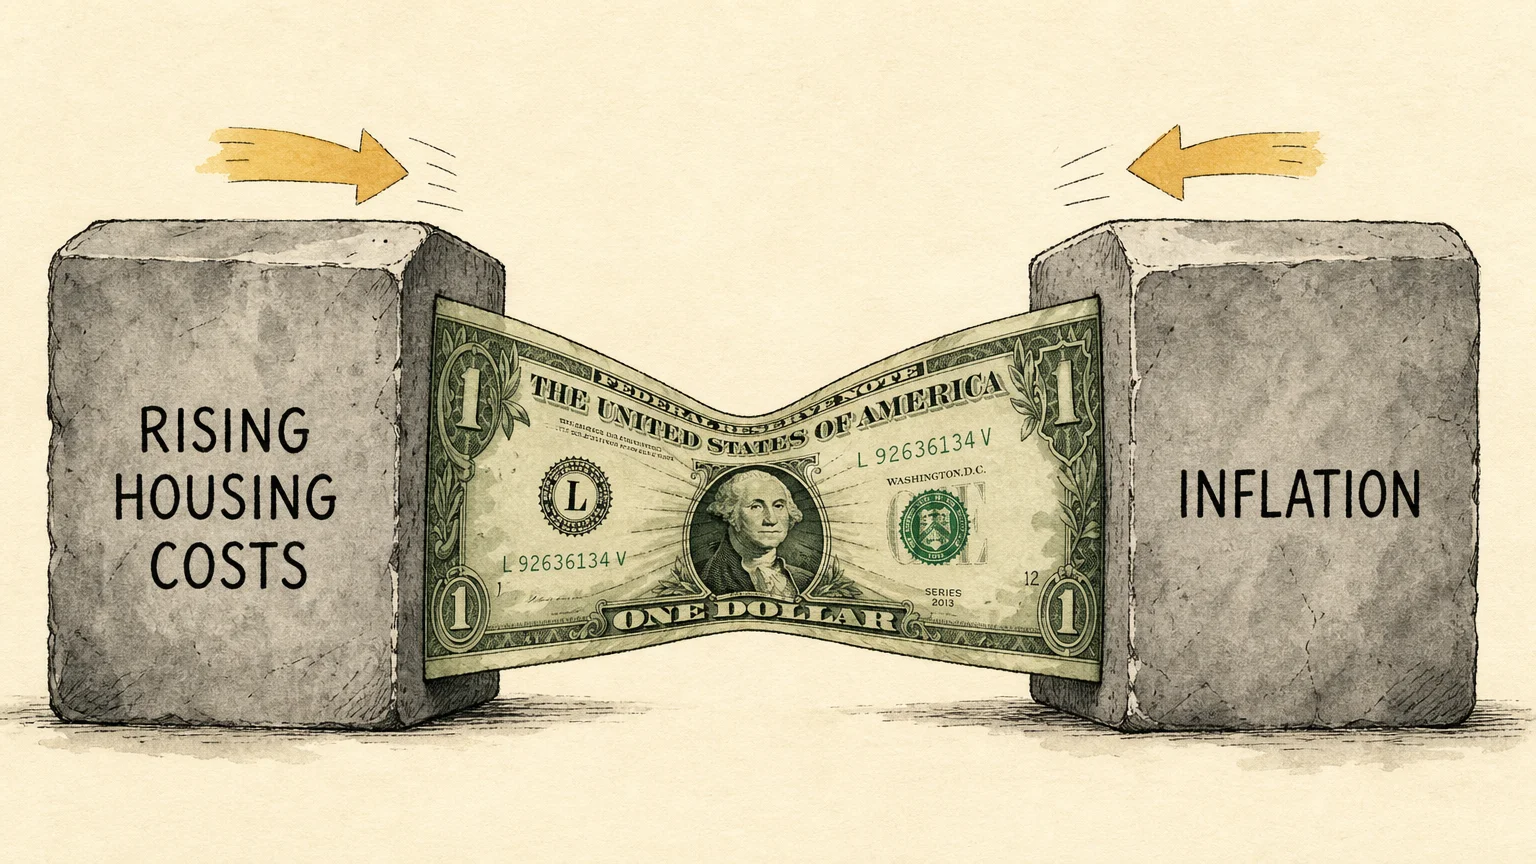
The traditional markers of a middle-class life have grown increasingly disconnected from middle-class income brackets. For many, hitting the statistical target no longer guarantees the lifestyle.
Cumulative inflation over the last five years fundamentally altered purchasing power. Even though annual inflation rates have cooled to the 2-3% range recently, the total cost of groceries, housing, and energy remains significantly higher than it was in 2021. If your wages increased by 10% over a five-year period but essential living costs rose by 20%, your real purchasing power declined. This disparity explains why many Americans earning six figures report living paycheck to paycheck.
The gap between income and wealth further complicates the picture. Income measures your cash flow; wealth measures your net worth and stability. A household earning $65,000 with a paid-off mortgage and healthy retirement accounts possesses far more economic resilience than a household earning $150,000 that carries massive student loan debt and rents in a high-cost metropolitan area. Statistically, the latter household is upper-middle class, but practically, they are far more vulnerable to a financial shock.

The Bigger Picture
The American middle class has been shrinking for decades. In 1971, approximately 61% of U.S. adults lived in middle-income households. Recent data indicates that number has fallen to roughly 51%.
This shift stems from income polarization. People are moving out of the middle class in both directions. The share of Americans in upper-income households grew from 11% in 1971 to 19% recently, which signals positive economic progress for millions. However, the lower-income tier also expanded from 27% to 30%. More concerning is the plunge in the aggregate share of national income held by the middle class. Decades ago, the middle class held the vast majority of total U.S. household income; today, upper-income households capture the largest share.

Worth Keeping in Mind
Understanding where your income falls is helpful for context, but rigid brackets can blind you to your actual financial reality. Keep these specific scenarios in mind as you assess your household finances:
- Debt alters everything: A $100,000 salary looks great on paper, but if you allocate $2,000 a month to student loans and high-interest credit card debt, your functional income drops significantly. The statistics ignore your liabilities.
- Relocating rarely offers a clean win: Moving from California to Arkansas drops your middle-class threshold drastically. However, unless you maintain a remote job with a coastal salary, local employers will pay local market rates, potentially negating the cost-of-living advantage.
- Temporary spikes warp the math: A one-time performance bonus, an inheritance, or a year of heavy overtime might temporarily push you into the upper-income tier. Base your long-term budgeting on your reliable base salary, not anomalous windfalls.
- Taxes shrink the pie differently by state: The thresholds discussed are based on pre-tax income. States like Texas and Florida lack a state income tax, while New York and California impose significant state levies. Your take-home pay dictates your true lifestyle limit.

When to Get Professional Help
Navigating the squeeze of modern cost-of-living pressures often requires strategies that go beyond basic budgeting. Consider consulting a Certified Financial Planner (CFP) or a Certified Public Accountant (CPA) if you find yourself in these situations:
- You earn a high income but have zero assets: If your household falls into the upper-middle class based on salary but you carry no emergency fund or retirement savings, a professional can help you audit your cash flow and implement automated asset-building strategies.
- You are nearing retirement with a shortfall: If you are within ten years of retirement and lack the capital to maintain your current middle-class lifestyle, a fiduciary advisor can help you structure catch-up contributions and adjust your timeline.
- You need a debt restructuring plan: When high-interest debt consumes more than 20% of your take-home pay, a financial professional can guide you through consolidation options, tax-advantaged borrowing, or strategic payoffs to reclaim your cash flow.
- Your household faces a major transition: Marriage, divorce, the birth of a child, or receiving an inheritance drastically alters your tax obligations and investment strategies. Professional guidance ensures you do not trigger unnecessary tax penalties during these shifts.

Closing Thoughts
Qualifying as middle class today requires a complex balancing act. Whether your household earns $55,000 in a rural county or $175,000 in a bustling city, the goal remains the same: transforming your cash flow into lasting stability. Focus less on which statistical tier you occupy and more on aggressively eliminating high-interest debt, building an emergency reserve, and investing consistently. Your financial security is measured by your safety net, not your statistical label.
The information here is meant for educational purposes. Specific circumstances—including health conditions, finances, location, and goals—may require different approaches. When in doubt, consult a licensed professional or check official sources directly.
Last updated: May 2026. Rules, prices, and details change—verify current information with official sources before acting on it.









Leave a Reply