
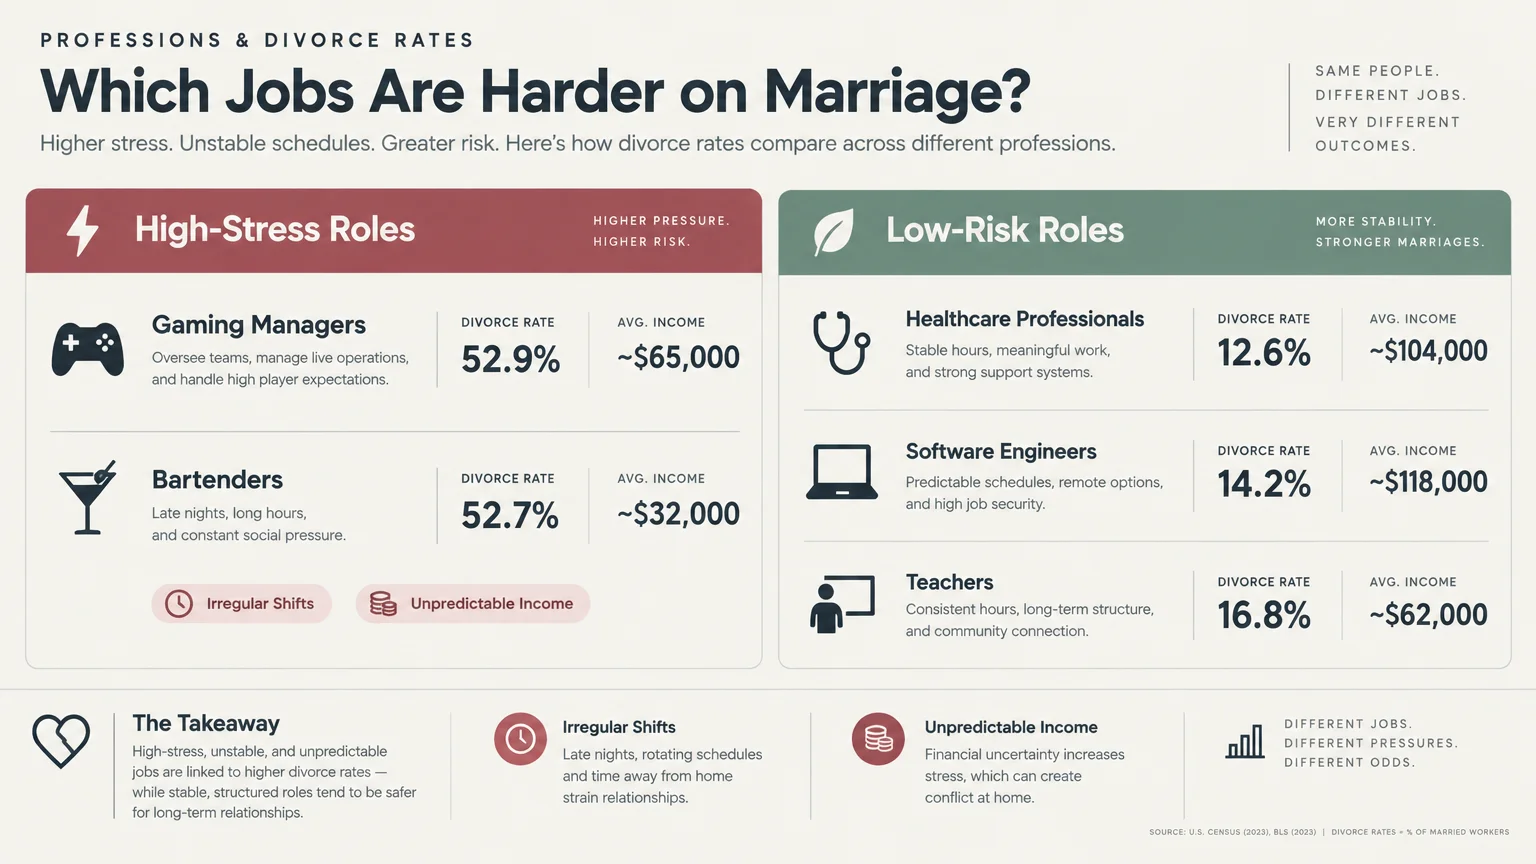
Comparing Divorce Rates Across Prominent U.S. Professions
Career and marriage stability often mirror the economic stability of a field. Comparing the highest-divorce jobs to the lowest-divorce positions highlights clear operational and financial differences.
| Occupation | Divorce or Separation Rate | Median Annual Pay | Primary Marital Stressors |
|---|---|---|---|
| Gaming Managers | 52.9% | ~$65,000 | Night shifts, casino environment, irregular hours |
| Bartenders | 52.7% | ~$31,000 | Late hours, alcohol exposure, volatile tip income |
| Flight Attendants | 50.5% | ~$68,000 | Frequent travel, time zone fatigue, physical distance |
| Active-Duty Military | 3.09% (Annual) | Varies by rank | Combat stress, prolonged deployments, relocation |
| Home Health Aides | ~47.0% | ~$33,000 | Physical burnout, emotional fatigue, low wages |
| Physicians & Surgeons | 20.1% | $239,000+ | Demanding shifts counterbalanced by high income |
| Software Developers | 18.9% | $130,000+ | Predictable schedule, remote flexibility, high pay |
| Actuaries | 14.2% | $120,000+ | Low physical stress, predictable hours, strong stability |
Actuaries hold the lowest divorce rate in the nation at just 14.2%. Their predictable working hours, strong mathematical problem-solving skills, and high salaries foster domestic stability.
Contrast that with frontline service trades where wages fluctuate wildly. Financial strain amplifies whatever relationship friction already exists.









This is a very important piece of work.
I can see casinos workers and bartenders as a higher rate for divorce in a few ways!