
Finding the most dangerous states—and seeing where yours ranks—depends on whether you look strictly at violent crime or broader financial and emergency risks. Headlines often blur these numbers together.
Nationwide, violent crime recently posted its largest single-year drop since 1936, yet sharp gaps remain between states like Alaska and Maine. Comparing state benchmarks against your local agency data reveals the real story.
Knowing how crime rates in 2026 affect homeowners insurance, relocation costs, and fraud exposure helps you protect your household. You can use these numbers to make calmer, smarter money decisions.
At a Glance
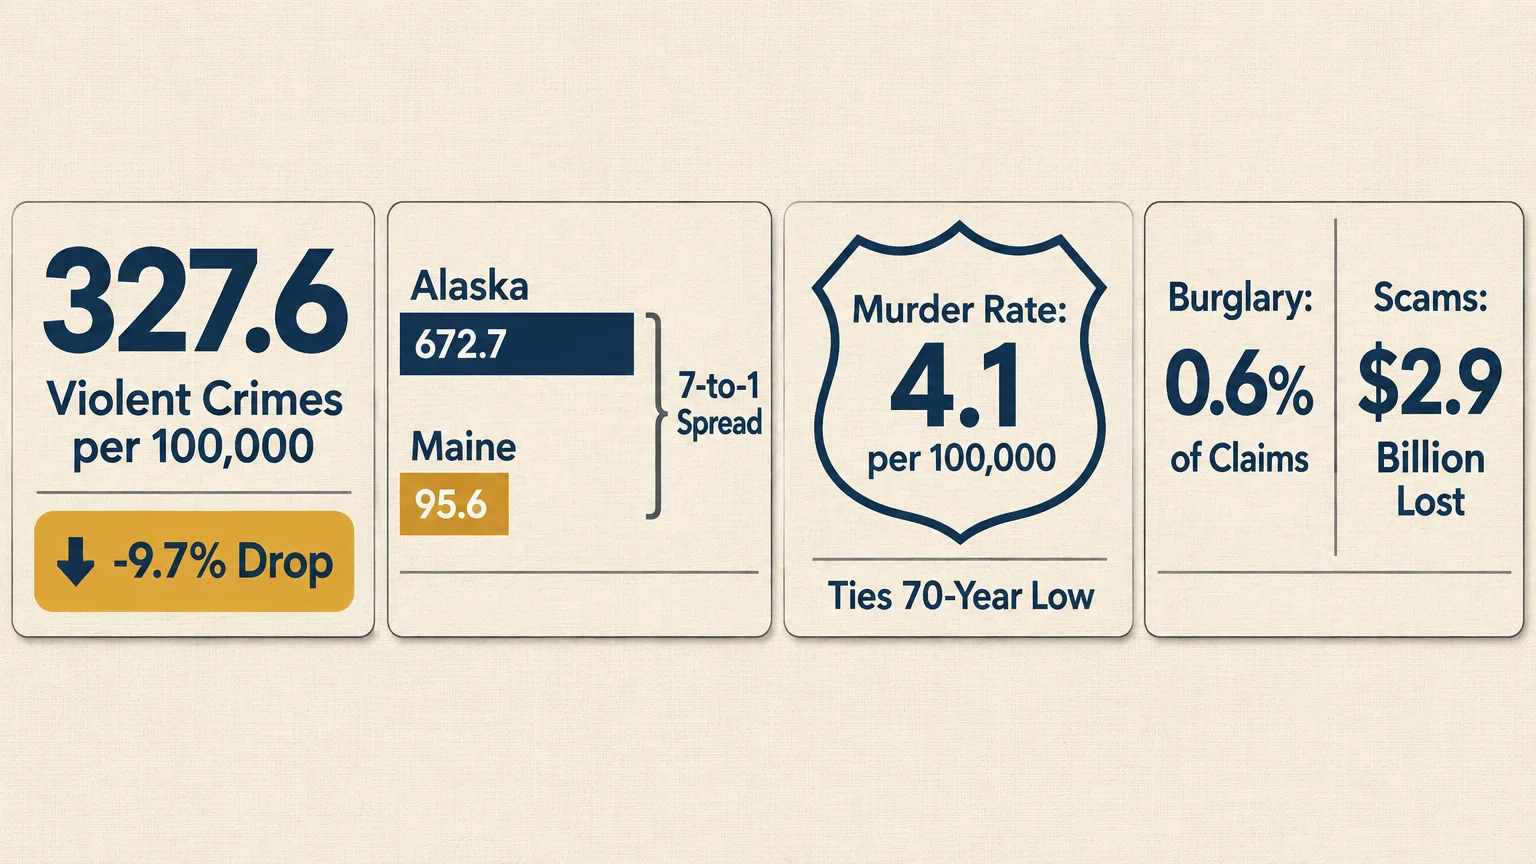
- Historic national declines: Federal data for 2025 shows the U.S. violent crime rate fell 9.7% to 327.6 per 100,000 residents, while murder rates tied a 70-year low.
- Wide state-by-state gaps: Alaska posted the highest state violent crime rate in 2025 data and Maine posted the lowest, mirroring a roughly 7-to-1 spread seen in 2024 benchmarks.
- Broader safety rankings shift the list: When financial security, uninsured rates, road deaths, and disaster readiness count alongside crime, Mississippi, Louisiana, and Texas sit at the bottom.
- Digital fraud dwarfs burglary losses: Call-center scams alone cost Americans over $2.9 billion in 2025, while theft makes up just 0.6% of homeowners insurance claims.
Why It Matters Now: Falling Crime vs. Rising Fear
Your perception of public safety probably feels worse than the latest federal crime data shows. According to Gallup polling cited in November 2026, 46% of U.S. adults still believe crime is rising nationwide.
That 46% share is actually the second-lowest level since 1989, trailing only 2001. Even so, nearly half the country assumes danger is growing during a period of steep statistical improvement.
According to the FBI’s Reported Crimes in the Nation, 2025 report—released August 14, 2026—law enforcement recorded 1,119,768 violent crimes nationwide. That equals a rate of 327.6 violent offenses per 100,000 residents, down from 362.9 in 2024.
The 9.7% drop in the violent crime rate marks the largest single-year decline since FBI estimations began in 1936. Total violent crime volume dropped 9.3% across 17,075 reporting agencies covering 96.2% of the U.S. population.
Multi-Decade Lows Across Violent and Property Offenses
Every major violent crime category moved sharply lower in 2025. Murder and nonnegligent manslaughter volume plunged 18.1%, pushing the rate down 18.5% to 4.1 per 100,000 residents.
That murder rate ties 1955 and 1956 for the lowest on record. Robbery fell 18.5% to a 20-year low rate, while rape declined 7.6% and aggravated assault dropped 7.2%.
Police clearance rates also improved, climbing from 43.8% in 2024 to 47.4% in 2025. Property crime fell 12.4% overall to 5,245,768 offenses, driven by steep drops across all three categories:
- Motor vehicle theft: Fell 22.7% in 2025—and 38.8% from 2023—pushing the rate down 23.0% to a 20-year low.
- Burglary: Dropped 15.8% to 661,800 offenses, sinking below 200.0 per 100,000 residents for a 20-year low.
- Larceny-theft: Declined 9.8% to a 20-year low below 1,200.0 per 100,000 residents, representing 74.5% of all property crimes.
Momentum continued into 2026. Preliminary figures on the FBI Crime Data Explorer for January through June 2026 show violent crime down another 10.6% compared to the first half of 2025.
During that six-month window, reported murder dropped 23.0%, robbery fell 19.6%, rape declined 18.6%, and aggravated assault fell 7.2%. Rolling 12-month data from August 2025 through July 2026 confirms violent crime down 8.4% and property crime down 12.0%.
What Household Surveys Reveal About Unreported Crime
Police reports never capture every incident because many victims never call law enforcement. To measure unreported offenses, the Bureau of Justice Statistics (BJS) conducts household interviews nationwide.
Preliminary results from the redesigned National Crime Victimization Survey—released October 26, 2026 from 101,980 interviews of residents age 12 and older—confirm the downward trend. Total violent victimizations reached 7.5 million in 2025, or 25.7 per 1,000 people.
Serious violent victimization dropped 25%, falling from 9.9 per 1,000 people in 2024 to 7.4 per 1,000 in 2025, led by a 31% drop in aggravated assault. Property victimization fell 19% to 14.9 million incidents, or 111.2 per 1,000 households.
For budget-conscious households, falling crime eases pressure on local insurance pools and municipal budgets over time. Still, national averages cannot tell you what happens on your block or in a state you plan to move to.
The Most Dangerous States by Violent Crime
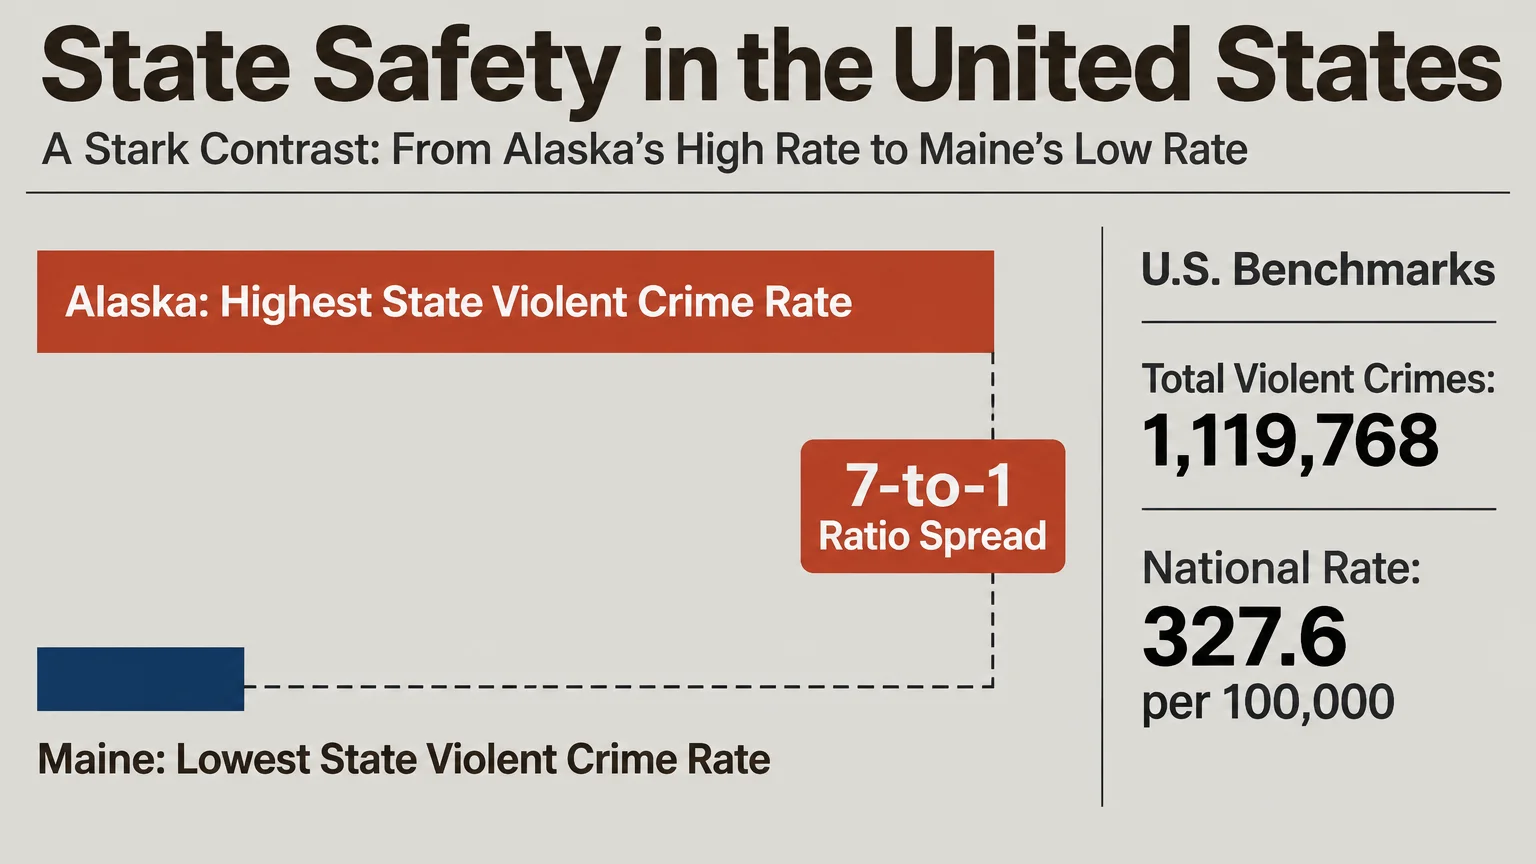
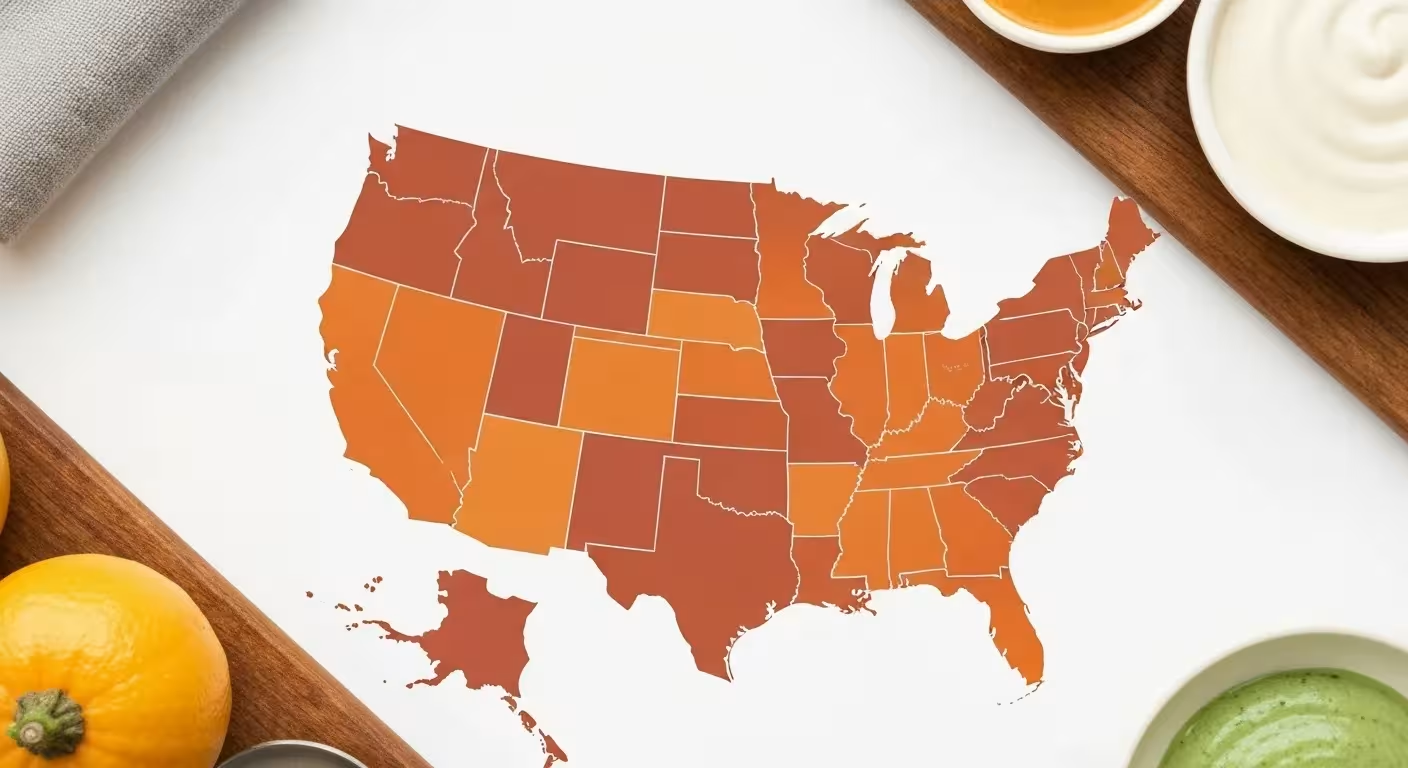
When analysts measure violent crime by state using police reports, the geographic gap is stark. According to a Newsweek analysis published August 21, 2026 of 2025 FBI data, Alaska had the highest violent crime rate among U.S. states, while Maine had the lowest.
Full 50-state and District of Columbia benchmark figures from 2024 FBI data illustrate just how wide that gap stretches. Against a 2024 U.S. violent crime rate of 359.1 per 100,000 residents—and a state median of 325.7—the highest-rate jurisdictions stand far above the norm.
| Jurisdiction | 2024 Violent Crime Rate (per 100,000) | 2024 Murder Rate (per 100,000) | Key Benchmark Context |
|---|---|---|---|
| District of Columbia | 1,005.5 | 25.5 | Highest overall; 10.0x Maine’s violent rate |
| Alaska | 724.1 | 6.9 | Highest U.S. state in 2024 and 2025 data |
| New Mexico | 717.1 | 10.5 | Also highest property crime rate (2,751.1) |
| Tennessee | 592.3 | 7.9 | Nearly 1.8x the 325.7 state median |
| Arkansas | 579.4 | 7.3 | Top-five state violent crime rate |
| Louisiana | 519.8 | 10.8 | Highest state murder rate in top-10 list |
| California | 486.0 | 4.5 | High violent rate; moderate murder rate |
| Colorado | 476.3 | 4.5 | Also appears in WalletHub’s bottom 10 |
| Missouri | 462.0 | 7.8 | Well above the 359.1 national benchmark |
| Kansas | 438.7 | 3.8 | Lowest murder rate among the top-10 violent list |
| Maine (Safest Benchmark) | 100.1 | Not listed | Lowest state violent rate in 2024 and 2025 |
Notice how murder rates do not always track overall violent crime rates. California and Colorado both posted a 4.5 murder rate in 2024—barely above the 2025 national rate of 4.1—yet high assault and robbery counts pushed them into the top ten.
Conversely, Louisiana’s 10.8 murder rate and New Mexico’s 10.5 murder rate sit more than double the national average. New Mexico also logged the nation’s highest property crime rate in 2024 at 2,751.1 offenses per 100,000 residents.
If your state is not listed above, remember the 2024 state median of 325.7 violent crimes per 100,000 residents. That figure nearly matches the 2025 national rate of 327.6, giving you a clean dividing line between higher-crime and lower-crime states.
Why Violent Crime Clusters in Specific States
Crime rates rarely reflect one simple cause, and the FBI formally warns against ranking states using raw Uniform Crime Reporting totals alone. Rough rankings, the bureau cautions, “lead to simplistic and/or incomplete analyses that often create misleading perceptions.”
Several structural factors push state totals higher or lower regardless of local policing quality:
- Urban density and transience: States with heavy tourism or concentrated metro hubs absorb offenses involving non-residents, which inflates per-capita rates calculated only against permanent residents.
- Economic stress and poverty: Higher unemployment, housing instability, and limited local services correlate closely with elevated assault, robbery, and property theft figures.
- Reporting coverage: More than 15,000 agencies covering nearly 90% of Americans now submit detailed incident data through the National Incident-Based Reporting System (NIBRS), up nearly 500 agencies from 2024, which improves accuracy over older estimates.
Beyond Street Crime: Overall State Safety Rankings
Violent crime is only one way your household faces physical or financial harm. Car crashes, workplace injuries, severe weather, lack of health insurance, and weak emergency savings can derail a family budget faster than street crime.
To capture that broader picture, WalletHub published its “Safest States in America in 2026” study in October 2026. The analysis scored all 50 states across 52 indicators divided into five weighted categories:
- Personal and Residential Safety (40 points): Assaults, murders, property crimes, and law enforcement presence.
- Financial Safety (15 points): Job security, poverty, debt stress, fraud exposure, and uninsured populations.
- Road Safety (15 points): Traffic fatalities, road quality, and impaired driving rates.
- Workplace Safety (15 points): On-the-job injuries and fatal occupational hazards.
- Emergency Preparedness (15 points): Natural disaster losses and community readiness.
When you combine all five categories, the safest states to live look remarkably consistent—even when compared against U.S. News & World Report‘s 2025 Public Safety rankings, which weight violent crime and incarceration rates.
| Category | WalletHub 2026 Rankings (Score) | U.S. News 2025 Baseline Top 10 |
|---|---|---|
| Safest States (Top 5) | 1. Vermont (66.63), 2. Massachusetts (66.58), 3. Maine (65.93), 4. New Hampshire (65.16), 5. Connecticut (63.40) | New Hampshire, Maine, Hawaii, Vermont, Massachusetts |
| Safest States (6–10) | 6. Utah (62.73), 7. Minnesota (61.77), 8. Indiana (60.83), 9. Rhode Island (60.19), 10. Hawaii (59.97) | Rhode Island, Utah, Connecticut, Idaho, New Jersey |
| Least Safe States | 50. Mississippi, 49. Louisiana, 48. Texas (39.83); bottom 10 also includes Georgia (41st), Alabama, Colorado, Missouri, Oklahoma, Arkansas | Not ranked in this format |
Why New England Leads—and Why Some Low-Tax States Drop
New England sweeps six of the top nine spots on WalletHub’s 2026 list and six of the top eight on the U.S. News ranking. Vermont, Massachusetts, Maine, New Hampshire, Connecticut, and Rhode Island pair low violent crime with strong emergency readiness and lower uninsured rates.
Utah, Minnesota, Indiana, and Hawaii round out WalletHub’s top 10, while Idaho and New Jersey join the U.S. News top 10. If you are weighing a move for retirement or remote work, these states consistently deliver lower day-to-day physical risk.
At the other end, state safety rankings shift dramatically once non-crime hazards enter the math. Mississippi ranks 22nd in personal and residential safety—better than half the country—yet drops to 50th overall because it finishes last in financial, road, workplace, and emergency preparedness safety.
Louisiana ranks 49th overall, placing 49th in both financial safety and emergency preparedness alongside its high murder rate. Texas lands at 48th with a score of 39.83, pulled down by the nation’s highest uninsured rate and a 48th-place finish in emergency preparedness.
Other bottom-10 states in WalletHub’s 2026 rankings include Georgia at 41st, alongside Alabama, Colorado, Missouri, Oklahoma, and Arkansas. That overlap shows why you should never judge a state’s true household risk by state income taxes or crime headlines alone.

How to Find Where Your State—and Neighborhood—Ranks
Because statewide figures average booming cities, quiet suburbs, and rural counties together, a single rank never describes your daily reality. You can find your exact state and local standing in about ten minutes using free federal tools.
- Check your state’s violent crime benchmark: Open the FBI Crime Data Explorer, select your state, and compare its latest violent crime rate per 100,000 residents against the 2025 national rate of 327.6 and the 2024 state median of 325.7.
- Drill down to your city or county agency: Filter the explorer by your local police department or county sheriff to see multi-year trends rather than a single noisy year.
- Verify NIBRS participation: Check whether your local agency submits NIBRS data, since roughly 10% of the U.S. population still sits outside full NIBRS reporting and relies on estimates.
- Factor in unreported property risk: Remember that BJS data shows only 40.7% of burglary and trespassing victimizations were reported to police in 2024, so pair official maps with local neighborhood watch or insurance quotes.
- Price out non-crime hazards: Before moving to a new state, request auto, homeowners, and flood insurance quotes to spot hidden costs tied to uninsured drivers, storms, or theft claims.
Comparing two ZIP codes inside the same state often reveals wider gaps than comparing two different states. Checking your local police agency’s five-year trend gives you far better information than any viral list.
What State Safety Means for Your Household Budget
Crime and state safety rankings show up directly in your monthly bills, especially through insurance premiums and fraud exposure. Understanding the real dollar odds helps you spend money where protection actually pays off.
Homeowners Insurance, Theft Claims, and Coverage Traps
Most homeowners overestimate how often insurers pay out for break-ins. According to a Forbes Advisor analysis published November 9, 2026—citing 2023 industry data—theft accounts for just 0.6% of all homeowners insurance claims.
When a theft does happen, however, it hurts your wallet: the average homeowners insurance theft claim reaches $5,524. If you carry a $1,000 or $2,500 deductible, your out-of-pocket hit takes a large bite out of your emergency fund.
Check your policy’s declarations page to see whether personal property is insured for Replacement Cost or Actual Cash Value (ACV). Replacement Cost pays to buy new equivalents of stolen laptops, tools, or appliances, while ACV subtracts years of depreciation.
High-value items like jewelry, firearms, bicycles, or camera gear also carry strict sub-limits on standard policies. If your belongings exceed those caps, adding a scheduled personal property endorsement usually costs far less than absorbing a multi-thousand-dollar loss.
Smart Home Security ROI vs. Expensive Contracts
You do not need a pricey multi-year monitoring contract to lower your burglary odds. FBI data cited by ConsumerAffairs in February 2026 shows 55.7% of break-ins involve forcible entry, meaning stronger locks, reinforced strike plates, and exterior lighting stop many attempts cold.
Visible deterrence matters too. A University of North Carolina study found roughly 60% of surveyed respondents said an alarm system would deter them and push them to seek another target.
Pair solid deadbolts and motion lights with a low-cost, no-contract security camera or self-monitored alarm kit. Before paying for professional monitoring, ask your insurer whether the discount actually exceeds the monthly fee.
The Bigger Threat to Your Money: Digital and Call-Center Fraud
Even if you live in Maine, Vermont, or New Hampshire, state lines offer zero protection against digital scammers. Financial crime now drains far more household wealth than street robbery or residential burglary.
According to 2025 data from the FBI’s Internet Crime Complaint Center (IC3) cited in October 2026, call-center fraud alone exceeded $2.9 billion in reported losses. Impersonation scams targeting retirees, taxpayers, and online shoppers drive much of that total.
Speed determines whether stolen funds come back. Through its Recovery Asset Team, the IC3 froze $679 million out of $1.16 billion in fraudulent transfers it acted on—a 58% freeze rate.
Turning on bank transfer alerts, freezing your credit files at all three bureaus, and refusing unsolicited phone instructions to wire funds or buy gift cards protects your savings far better than worrying about statewide street crime averages.

Common Mistakes to Avoid
Even careful savers misread state safety rankings when choosing where to live or how to insure their homes. Watch out for these four costly errors:
- Treating a state ranking as a neighborhood verdict: A high-crime state like California or Colorado contains hundreds of quiet suburbs, while the safest states to live still have high-theft corridors.
- Chasing zero state income tax without checking insurance costs: States like Texas may look cheap on paper, yet high uninsured-driver rates, storm losses, and property insurance premiums can erase tax savings fast.
- Picking Actual Cash Value coverage to shave a few dollars off premiums: Saving $10 a month on an ACV policy can cost you thousands in depreciated payouts after a $5,524 theft or fire loss.
- Spending thousands on physical gear while ignoring cyber hygiene: Locking every window while reusing weak bank passwords leaves your retirement savings exposed to call-center and wire fraud.
Getting Expert Input
Public crime data gives you a reliable starting point, yet major financial and relocation choices deserve tailored feedback. Consider consulting a qualified professional in these four situations:
- Reviewing home and auto coverage before a move: Ask an independent insurance broker licensed in your destination state to compare Replacement Cost endorsements, deductibles, and uninsured-motorist limits across multiple carriers.
- Weighing total relocation costs: Talk with a fee-only financial planner or tax professional before moving across state lines so you model property taxes, insurance spikes, and emergency reserves together.
- Upgrading residential security on a budget: Contact your local police department’s crime-prevention officer—many agencies offer free home walk-throughs that pinpoint weak locks and lighting without selling you equipment.
- Responding to suspicious transfers or impersonation scams: Call your bank’s fraud department immediately and file a report at IC3 so specialists have the best shot at freezing funds before they clear.
Frequently Asked Questions
Which U.S. state has the highest violent crime rate right now?
According to a Newsweek analysis of 2025 FBI data, Alaska has the highest violent crime rate among U.S. states, repeating its 2024 benchmark position at 724.1 violent crimes per 100,000 residents. Among all jurisdictions, the District of Columbia ranks higher at 1,005.5.
What is the safest state to live in 2026?
Maine posted the lowest violent crime rate in both 2024 (100.1 per 100,000) and 2025 FBI data. In broader multi-factor safety rankings for 2026, WalletHub ranks Vermont first overall ahead of Massachusetts and Maine, while U.S. News puts New Hampshire first.
Are crime rates in the U.S. actually going up or down?
Crime rates are falling sharply. FBI data for 2025 shows violent crime dropped 9.7%—the biggest one-year decline since 1936—and preliminary first-half 2026 figures show violent crime down another 10.6%, alongside steep drops in BJS victimization surveys.
Why do different state safety rankings disagree on the same state?
Different rankings measure different risks. Pure FBI tables track only reported violent and property offenses, whereas WalletHub includes financial stress, road deaths, workplace injuries, and disaster readiness—causing states like Mississippi and Texas to rank much lower overall.
Putting State Safety Data to Work
You do not need to panic over scary headlines or rely on guesswork when comparing where your state ranks. Use the FBI Crime Data Explorer to benchmark your local police agency, verify your homeowners policy covers Replacement Cost, and lock down your bank accounts against fraud.
The information here is meant for educational purposes. Specific circumstances—including health conditions, finances, location, and goals—may require different approaches. When in doubt, consult a licensed professional or check official sources directly.
Last updated: November 2026. Rules, prices, and details change—verify current information with official sources before acting on it.








Leave a Reply